How Does Hem Beer Equipment Improve Brewery Performance?
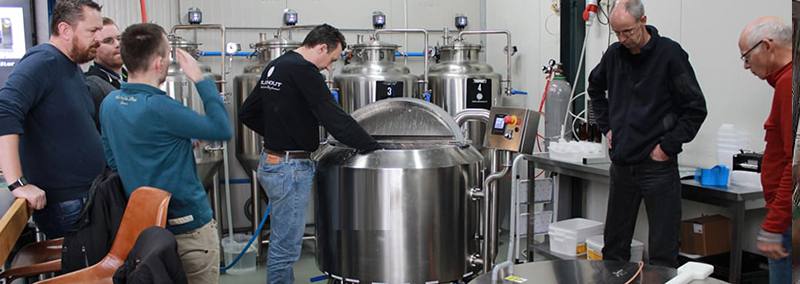
Hem beer equipment can improve brewery performance when vessel sizing, heat transfer, wort movement, fermentation cooling, CIP, and controls are designed as one production line rather than separate machines. MBAA published a 2019 brewhouse example at 86% efficiency, while Brewers Association benchmarking separates breweries into top 25%, middle 50%, and bottom 25% groups for water, electricity, natural gas, waste, and purchased CO₂ use. A properly specified HEM setup can help a brewer work toward better numbers by reducing extract left in spent grain, stabilizing mash and fermentation temperatures, shortening transfers, recovering useful heat, and giving cleaning cycles repeatable flow, concentration, and contact time. Performance still depends on recipes, utilities, operating procedures, and staff practices.
A brewhouse first has to recover enough extract from the malt. MBAA's 2019 technical paper gives an example of 13.6°P wort against a 15.8°P laboratory extract potential, producing 86% brewhouse efficiency. On a brewery processing 500 kg of malt per batch, even a 3-percentage-point difference in extract recovery becomes significant when repeated over 250 or 300 brews per year. Equipment cannot set efficiency by itself, but mash mixing, grain crush, temperature distribution, false-bottom design, rake operation, sparging, and wort collection all affect how much available extract reaches the kettle.
That extraction stage places specific demands on temperature and mash conditions. MBAA guidance for small brewers lists mash pH around 5.5–5.6 when measured at 20°C and around 5.2–5.3 at 65°C, with calcium above 50 ppm supporting brewing performance. Another MBAA technical discussion recommends mash-out and sparge temperatures around 80°C (176°F) as one way to reduce wort viscosity and improve runoff. A brewhouse with stable heating, useful sensor placement, controllable agitation, and predictable flow gives the brewer a better chance of repeating those process settings rather than correcting temperatures after they have moved outside the recipe range.
A 1°C difference looks small on a control screen, but a brewery repeating the same recipe 200 times per year needs the mash, wort cooling, and fermentation stages to behave similarly on batch 200 and batch 1.
Once wort leaves the mash and lauter stage, vessel scheduling starts to affect daily output. A 10 hL brewhouse producing two turns supplies 20 hL of wort, while four turns supply 40 hL; the nominal vessel size has not changed, but pumps, heating capacity, lautering time, whirlpool residence, heat-exchanger capacity, hot-liquor availability, and cleaning time must support the extra turns. A hem brew system therefore needs to be specified around intended turns per day and cellar capacity rather than the brewhouse volume printed on a quotation.
Heating and cooling deserve the same calculation because beer production repeatedly moves large liquid masses across wide temperature ranges. A 2022 MBAA paper modeling 100,000 hL of alcohol-free beer used 5% boil evaporation in its calculations and treated wort cooling as a two-stage water/glycol process. Its modeled first cooling stage brought wort to 20°C before glycol completed the remaining temperature reduction. The figures are process-study assumptions rather than guaranteed HEM performance, but they show why heat-exchanger area, coolant temperature, water flow, glycol capacity, and incoming wort temperature need to be sized together.
| Process point | Published reference figure | Equipment issue to check |
|---|---|---|
| Brewhouse efficiency example | 86% | Milling, mash, lautering and wort recovery |
| Mash pH at 20°C | 5.5–5.6 | Measurement and process control |
| Mash pH at 65°C | 5.2–5.3 | Temperature-correct process target |
| Mash-out/sparge reference | 80°C / 176°F | Heating and lautering control |
| Modeled boil evaporation | 5% | Kettle heating and vapor handling |
| First-stage wort cooling | 20°C | Heat exchanger and cooling-water supply |
Cooling capacity becomes more important after the heat exchanger because fermentation releases heat rather than simply holding beer at room temperature. If six fermenters require cooling at the same time, designing refrigeration around the demand of one tank creates an obvious mismatch. Tank volume, yeast activity, fermentation setpoint, ambient conditions, insulation, jacket area, glycol supply temperature, pump capacity, and simultaneous demand all belong in the calculation. A brewery expanding from four tanks to 12 tanks may therefore need additional refrigeration even when the original brewhouse remains unchanged.
Fermenter construction then determines how accurately that cooling can be applied. Separate cooling zones can be useful on taller vessels because the liquid level changes as tanks are filled, transferred, or used for partial batches. Temperature probes need representative placement, while pressure-rated fittings, relief devices, sample points, sanitary valves, and cleaning devices need to match the intended process. In a brewery completing 250 batches in a year, an operator dealing with inconsistent temperature measurement on even 5% of batches is handling more than 12 batches that require additional attention.
Cellar sizing also controls how often the brewhouse can actually run. A 20 hL brewhouse producing 40 hL per day cannot maintain that rate when only 100 hL of fermentation capacity is available and beer occupies a fermenter for 14 days. Adding brewhouse turns does not solve a tank-occupancy problem. HEM equipment planning is more useful when production volume, average fermentation duration, maturation time, annual brew count, seasonal peaks, and planned tank additions are calculated before finalizing vessel quantities.
That capacity calculation should continue into pipework. Pumps are often discussed by motor power or maximum flow, yet pipe diameter, vertical lift, bends, valves, wort viscosity, pressure loss, and required transfer time determine actual operation. Moving 20 hL in 20 minutes requires an average product flow of about 100 L/min before allowances for operating conditions. Moving the same volume in 40 minutes cuts the average requirement to 50 L/min but occupies equipment twice as long, which can affect a brewery attempting three or four brewhouse turns in a working day.
Shorter transfer time is not useful when the transfer produces excessive shear, poor whirlpool behavior, cavitation, or difficult cleaning, so pump selection has to follow the process. Variable-frequency control can give operators a wider usable flow range than simple on/off operation. Flow control also matters during lautering, where drawing wort too aggressively can compact the grain bed. MBAA's 2019 discussion of extract recovery uses bed permeability and Darcy's law to explain why runoff behavior, grain particle size, porosity, temperature, and rake operation affect lautering performance.
Faster is not automatically better. A pump capable of 150 L/min still needs a process that can accept 150 L/min without disturbing the grain bed, overloading a heat exchanger, or reducing whirlpool performance.
Cleaning places another measurable limit on brewery availability. A published study examined CIP on two industrial microbrewery systems using 450 L and 900 L fermenters. The researchers tested caustic concentrations from 0.5% to 2.0% v/v in 0.5-percentage-point increments and temperatures from roughly 18–21°C up to 60°C. ATP measurements were taken during cycles, with tests running until acceptable results were obtained or 60 minutes had passed.
The study found that 0.5% v/v caustic failed to meet the required tolerance, while 1.0% v/v did not produce acceptable results consistently. At 1.5% v/v, acceptable cleaning was reached in roughly 30–40 minutes; 2.0% v/v generally reached the target in 20–30 minutes under the study conditions. Those results should not be copied blindly into another brewery's sanitation program because chemical formulation, soil, spray coverage, water chemistry, tank geometry, and supplier instructions differ, but the research shows why concentration, contact time, flow, and mechanical coverage must be controlled together.
For equipment design, the lesson is practical. A CIP skid needs enough pump capacity for the intended spray device and pipe circuit, while return lines need to handle the returning liquid without backing up the vessel. Chemical tanks need appropriate working volume, and temperature, concentration, and cycle time need to be measurable. If a brewery cleans 10 vessels per day and removes only 10 minutes of unnecessary waiting from each cycle, it releases about 100 minutes of staff and equipment time per day without increasing fermenter count.
Water use deserves similar measurement because brewing water includes much more than the water entering the recipe. Vessel rinsing, floor cleaning, keg or package operations, CIP, cooling, and utility processes add to total consumption. The Brewers Association maintains benchmarking tools covering water, electricity, natural gas, solid waste, and purchased CO₂, and its five-year benchmarking report groups performance by annual packaged production: below 1,000 bbl, 1,000–10,000 bbl, 10,000–100,000 bbl, and above 100,000 bbl. Comparing breweries within production bands is more useful than applying one consumption number to every facility.
The same Brewers Association report divides participants into top 25%, middle 50%, and bottom 25% performance groups. Its example electricity chart shows why equipment selection should be connected to metering: a brewery cannot tell whether insulation, pump control, refrigeration changes, or heat recovery improved consumption unless electricity and production volume are recorded together. The Association also states that the submitted benchmarking data are self-reported, an important limitation when using peer figures for engineering or financial planning.
Energy measurement can start with the brewhouse because heating wort and then cooling it creates an opportunity to reuse heat. A properly sized plate heat exchanger can transfer wort heat into brewing water, allowing the warmed water to feed a hot-liquor tank for later brewing or cleaning. The 2022 MBAA process model used wort specific heat of about 4.1 kJ/kg/K and water specific heat of 4.18 kJ/kg/K. At brewery scale, moving thousands of liters through a temperature change of tens of degrees represents substantial thermal energy, so heat recovery deserves attention before adding larger heaters.
Insulation affects the other side of the same energy balance. Fermenters, bright tanks, hot-liquor tanks, and heated brewhouse vessels operate at temperatures different from the surrounding room for many hours. A tank holding 20 hL of beer near 0–2°C in a warm production space continuously receives heat through its shell, fittings, and poorly insulated areas. Good insulation does not remove refrigeration demand, but reducing unwanted heat transfer lowers the work required from the glycol system across hundreds of tank-days per year.
Automation can then keep the mechanical system closer to the operating settings chosen by the brewer. Temperature controllers, pump speed control, level indication, timed process stages, valve feedback, pressure monitoring, and recipe-based sequences can reduce repeated manual adjustments. If an operator checks eight fermenters six times during a shift, that is 48 manual checks; centralized monitoring can reduce routine walking and recording while still requiring staff to inspect equipment and respond to abnormal readings.
Automation should remain proportional to brewery size. A small operation producing 1,000–10,000 bbl per year may gain more from dependable temperature control, VFD pump operation, and clear alarms than from a highly automated brewhouse that adds maintenance complexity. A facility above 100,000 bbl per year can justify a different control level because a small time difference repeated across hundreds or thousands of transfers, CIP cycles, and batches produces a much larger annual effect.
Maintenance access needs to be considered before the tanks are installed. A valve that cannot be reached easily still needs inspection; a pump placed against a wall still needs seal service; a plate heat exchanger still needs opening and cleaning when required. Leaving service clearance around pumps, manways, motors, valves, heat exchangers, and control panels may use several percent more floor area during layout planning, but it can reduce the amount of production equipment that must be moved during routine maintenance.
Floor layout also affects labor. If malt handling, brewhouse vessels, heat exchanger, cellar, CIP station, and utilities follow the production sequence, operators make fewer long hose runs and unnecessary movements. On a facility producing 300 batches per year, saving 15 minutes of non-production movement per batch equals 75 labor hours annually. The figure is a simple planning example rather than a performance claim, but it shows why a brewery layout should be evaluated in minutes and meters as well as vessel capacity.
Expansion planning belongs in the same layout discussion. A brewery starting with six fermenters may expect to reach 10 or 12 within several years. Space alone is not enough; glycol headers, chiller capacity, electrical supply, compressed air, CO₂ distribution, drainage, CIP capacity, and control-panel I/O need room for expansion. Providing connection points during the first installation can be less disruptive than reopening finished pipework after production has reached 70% or 80% of installed cellar capacity.
A brewery can therefore evaluate HEM equipment with a measurable acceptance sheet rather than broad descriptions. Record target batch volume, expected brewhouse efficiency, heating time, wort-cooling time, transfer rate, fermentation temperature tolerance, CIP flow, utility requirements, vessel working volume, pressure rating, and expected turns per day. Run those figures against at least 12 months of planned production so the equipment is judged by annual operating requirements rather than the performance of a single brew day.
When the numbers are connected, brewery performance becomes easier to manage. An 86% brewhouse efficiency reference, a 20-minute transfer target, a 1.5–2.0% CIP test range from published research, a 5% modeled evaporation rate, or a 12-fermenter cooling calculation each describes only one part of production. HEM equipment contributes most when the brewhouse, cellar, cooling, cleaning, piping, and controls are sized from the same batch schedule and then checked against measured production data after commissioning.